
Introduction
Many factors can influence an individual’s decision making when selecting political candidates for office: policy agenda, political affiliation, and even personal traits. To some extent, voters use an array of factors to determine who and why they should vote for a particular candidate over another. What factors influence Black voters’ voting behavior? Is there a significant difference in the voting behavior among Black voters and their preferences of candidates who runs for office? Does race or gender matter to Black voters when selecting a candidate?
A study that examined racial group consciousness among African Americans and Black ethnics found that racial solidarity among Black voters in America tends to hold firm among this group due to their shared experiences of discrimination, ideology, interests, and leadership (Austin et al., 2012). Turnout of the Black vote can also be a response to candidate preferences and political opposition. For example, studies using longitudinal survey methods have shown that Black voter turnout during the presidential elections of 1984 and 1988 was influenced by candidate preferences and political opposition (Tate, 1991). This is important because mobilization efforts such as party activities and campaigning also play a significant role in voter turnout at the state level (Patterson & Caldeira, 1983).[1]
The motivation of this paper is to explore theories and concepts about political empowerment, racial solidarity, and political mobilization of Black voters and their candidate preferences in the state of Florida. Political empowerment theory suggests the idea that when minority individuals share the same descriptive characteristics (i.e., race or ethnicity) as a potential candidate, their participation in politics would be increased in a positive manner (Banducci et al., 2004; Bobo & Gilliam, 1990; Washington, 2006). However, previous research has also noted that when Black voters elect someone from the Black community, large voter turnout in these areas reverts back to normal and can have the tendency to drop in some urban community voting locations once political incorporation is achieved (Browning et al., 1979, 1984).
The literature claims that it may be the case that the energy from the previous campaign efforts to get someone Black elected dies off because of declining interest in politics becoming routine (Tate, 1991). Moreover, in regards to Black voters and turnout, research has provided evidence that the context of the election is important because empirical evidence shows that Black voters have a tendency to react to short-term political forces that are significant at the moment (Campbell, 1960). This theory of political empowerment is used in this paper to provide an understanding of minority groups and their political activity when a candidate shares the same descriptive characteristics as the group.
In addition, Black voting behavior has seen increases in voter participation despite the group’s low socioeconomic status (Chong & Rogers, 2005), which has been explained by the groups shared experiences and their perspective of linked fate using the concept of racial solidarity (Austin et al., 2012). For example, a study that examined racial group consciousness among African Americans and Black ethnicities found that racial solidarity among Black voters in America tends to hold firm among this group due to their shared experiences of discrimination, ideology, interests, and leadership (Austin et al., 2012). In addition, research claims that racial solidarity among Blacks, which highlights racial group consciousness, allows individuals of the same race/ethnicity to engage in behavior that benefits the group (Dawson, 1995).
Therefore, Black voters both U.S.-born and immigrants have been documented as sharing similar racial experiences notwithstanding their differences in ethnic backgrounds, which also explains their similar politicized views (C. W. Smith, 2013). Ethnicity is an important factor to consider when exploring the voting behavior of groups. Research has shown that there is an ethnic consciousness that exists when people think of associating themselves with a specific nationality group, and once that selection is made, they make decisions based on that specific group’s perceived ideas and beliefs moving forward (Glazer & Moynihan, 1970). The concept of racial solidary allows for us to comprehend why individuals with different values and beliefs come together for common causes based on experiences of racial discrimination.
The theory of political mobilization provides another perspective because Black voters both U.S.-born and immigrants are exposed to similar influences of mobilization efforts, which is a result of them typically sharing the same Black institutions (i.e., organizations and churches) and living in nearly identical environments (Calhoun-Brown, 1996). This particular theory has set the research agenda for how mobilization efforts affect voter turnout and which efforts are most effective (Rosenstone & Hansen, 1993). Studies have also claimed that mobilization efforts such as party activities and campaigning also plays a significant role in voter turnout at the state level (Patterson & Caldeira, 1983). The use of political mobilization theory in this paper allows for us to explore strategies used to effect voter turnout among minority groups.
We predict that there is no difference in Black voter candidate preferences based on race and gender, which affirms that descriptive representation does affect the group. However, we also predicted that when a Black candidate is introduced on a presidential ticket (i.e., Kamala Harris), there will be a difference in the overall opinions and considerations among the group in Florida, which affirms that mobilization efforts in the Black community did affect the group. This paper will examine the Black voting behavior in the state of Florida through the lens of the different demographical makeup of Black voters. Using original survey data conducted after the 2020 Presidential Election, we then explore the results based on theories and concepts about political empowerment, racial solidarity, and political mobilization of Black voters and their candidate preferences in the state of Florida.
Descriptive Representation? Chisholm, Jackson, and Obama
To provide context to the importance of Black candidates on a major party ticket for the presidency, we must further explore Black candidates who pioneered the way such as Shirley Chisholm, Jesse Jackson, and Barack Obama. For example, Black American voters first witnessed a Black candidate represent a major party ticket in 1972, and that candidate was an African American woman named Shirley Chisholm. At the Democratic National Convention, Chisholm also went on to receive about 152 delegates, which put her in fourth place for the party. Although much of her support came from Black voters, many Black leaders and organizations did not get her full support because she was considered too radical for some Black voters (Sinclair-Chapman & Price, 2008). This led to Chisholm not capturing her base as it relates to descriptive representation. For example, although she tried to establish an independent Black political coalition, she did not target Black feminists and younger delegates, and this showed because they did not rally to support her. In addition, it is also interesting that Chisholm’s age was never discussed. For example, candidates similar in age (e.g., Barack Obama) were attributed as being youthful as an attribute, while Chisholm was not granted the same luxury because her youthfulness and age were never noted by the media (Harris, 2012).
In 1984 Jesse Jackson was able to receive 358 delegate votes and over 3.2 million popular votes and received greater numbers in 1988 with 1,023 delegates and over 6.9 million popular votes. This was the first attempt during a presidential election where a candidate of color tried to unite races and ethnicities. Rainbow Coalition is the term Jackson used for his campaign-building strategy in 1984 and 1988 (R. C. Smith, 1996). The thought behind his approach was to create an inclusive coalition around “peoples of color” – Blacks, Latinos, Asians, and Arab Americans – and whites who were liberal or progressive (i.e., a multiracial coalition).
Although Jesse Jackson was the second African American to run for the presidency with a national campaign after Shirley Chisholm, historians consider Jackson to be the first African American to put forth a serious campaign for the presidency (Harris, 2012). However, to revisit descriptive representation again, Jackson like Chisholm before him also faced obstacles with the Black vote. For example, leaders in the Black community (i.e., Black mayors and heads of associations) wanted Jackson to not run for office and to support a white liberal who “actually” had a chance instead. There were also conflicts among the groups – i.e., other people of color embracing negative stereotypes about blacks and socioeconomic competition among them (McClain et al., 2006; McClain & Karnig, 1990).
However, Barack Obama accomplished the goal that both Chisholm and Jackson set out to accomplish by becoming the first Black President of the United States of America. Obama was able to capture the presidency by using a race-neutral campaign that was inclusive to all who sought “change” (Harris, 2012; Walton et al., 2017). Although he was a politician on the state and then national level, he was considered a young charismatic individual who common people could gravitate towards. For example, Obama’s voter turnout in both 2008 and 2012 was not only high among African American and Blacks from the diaspora but also among foreign-born blacks who saw the most significant increase in turnout compared to Asian, Hispanic, and white immigrants (Thomas & Tesfai, 2019). As it relates to descriptive representation, Obama was born in Hawaii and of mixed race (e.g., half Black African and white American). However, Obama was also scrutinized by Black voters because of his respectability politics and “wink, nod, vote” tactics instead of providing substantial policy toward the Black community (Harris, 2012).
After briefly discussing Chisholm, Jackson, and Obama, this now leads us to our exemplar for this study, Kamala Harris. Harris was selected as the vice presidential nominee shortly after Joe Biden won the Democratic Party presidential nominee. Joe Biden served as the vice president under both Obama administrations, so we assume that it is not a mistake in why she was his front-runner. In 2016, we saw a shift in politics that led to national support towards women running for high political offices – i.e., Hillary Clinton’s run for the presidency. However, although Hillary had the qualifications for the job, there have been claims that Clinton’s momentum was somewhat short-lived due to her campaign’s assumption that they would have received the same support from an array of communities as Obama’s 2008 and 2012 campaigns did in several swing states.
Biden’s selection of Harris as the vice presidential nominee may have considered race and gender as factors. For instance, not only does Harris have the political and professional background for the job, but she also offers unique descriptive representation qualities – i.e., being a woman and a “person of color,” which we will refer to as “woman of color.” This is a quick glimpse of the clash of ideas among the Black vote that can lead to complexities and nuances. The trend above shows a transition from Black candidates being seen as too radical, to untimely, and then the acceptance of “change.” This brief narrative was conducted to provide context to political empowerment, racial solidarity, and political mobilization of Black voters. However, what does this inform us about their candidate preferences?
Methods
We conducted a survey of Black voters in the state of Florida. The participants of the survey came from six counties: Broward, Duval, Hillsborough, Leon, Miami-Dade, and Orange. Five out of the six counties have the largest population of voters who classify themselves as Black in the state. The population of Blacks who are registered to vote in the state of Florida is about 1.86 million. The targeted sample size for this study was 385, which would give us a 95% confidence level, 5% margin of error, was about 64 individuals per county. The survey was approved by the Institutional Review Board (IRB). The survey mode for this paper was electronic using the Qualtrics platform to distribute the survey to participants. The participants for the survey were Black registered voters in the State of Florida.
The sample was achieved by using a simple random sampling method for the counties (cluster groups) used for this study. The simple random sampling selected 35,649 individuals with 646 responses.[2] Due to some individuals not completing the survey, and contact information error, our final sample size was 446 Black registered voters, which exceeded our target sample size. This paper uses descriptive statistics for the response variables of interest, which are the following: what they considered in a candidate running for office (both most important and least important) and the influence of Kamala Harris as the Democratic Party Vice President on their vote decision. The main explanatory variable of interest is gender. The additional explanatory variables for this study are age, party affiliation, and education.
The response variable is the decision influence of Kamala Harris as the Democratic Party Vice President, which consists of three categories: discouraged your vote, encouraged your vote, or had no influence on your vote. For the explanatory variables, Gender is a dichotomous variable: male and female.[3] The age variable has five options to select: 18-24, 25-32, 33-49, 50-64, and >65. The party affiliation variable is also a dichotomous variable: Democratic Party and other. The education variable had four categories to pick from: high school/GED/trade, some college, bachelor’s degree, and advanced degree. For the ethnicity variable, there were three choices for respondents to select: African American, Black Caribbean, and other.
The paper uses multinomial logit regression analysis to estimate models because the outcome variable is categorical. Therefore, this model is appropriate because individual participants were only able to select only one alternative. We used frequencies to summarize the categories for the dependent variable because the data was nominal. The data was used in wide format where each individual i was placed in its own row. The dependent variables for the multinomial regression analysis were treated as alternative-invariant or case-specific regressors. This is important to note because the choice the individual selects did not cause any variation differences for each individual. In addition, we use the exponent of the multinomial logit coefficients (i.e., the relative risk ratio) to interpret the results directly with magnitudes for respective increases or decreases.
Results
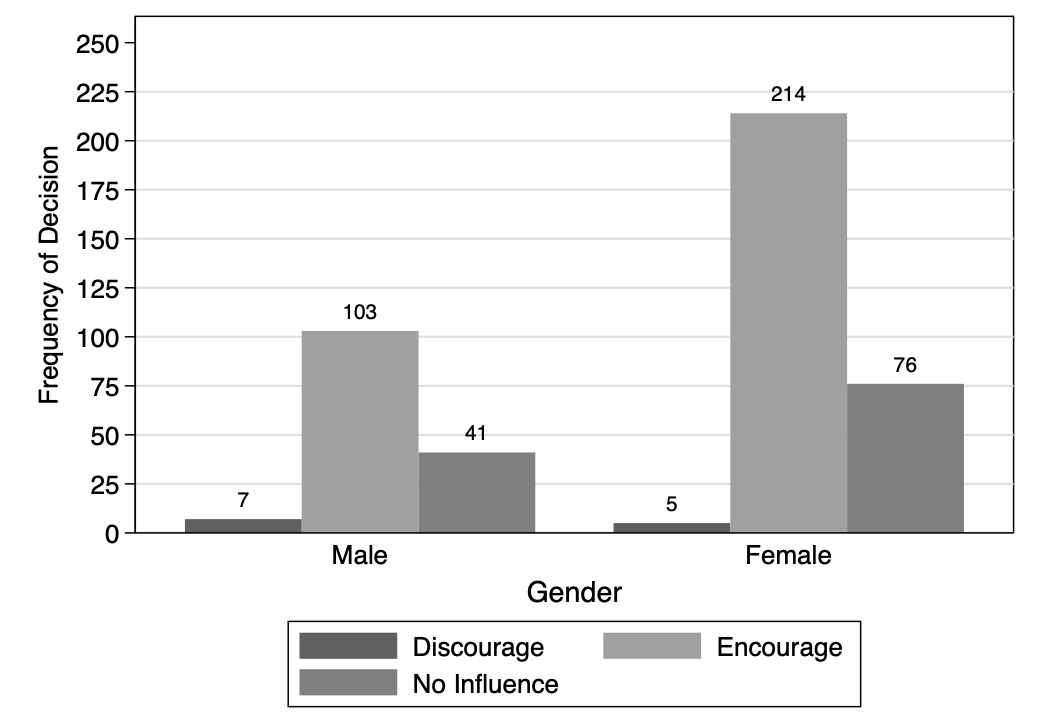
The female group (67.5%) was higher than the male group in the encouraged to vote by the Democratic VP selection option in comparison to the male group (32.5%) (see Figure 1). Moreover, the female group (65%) also led the option of not influenced to vote by the Democratic VP selection option in comparison to the male group (35%). However, the male group was higher in the option of being discouraged to vote by the Democratic VP selection at 58.3 percent than the female group at 41.7 percent. The Pearson chi-square was 3.5 with a p-value of 0.17, so the variables are not independent.
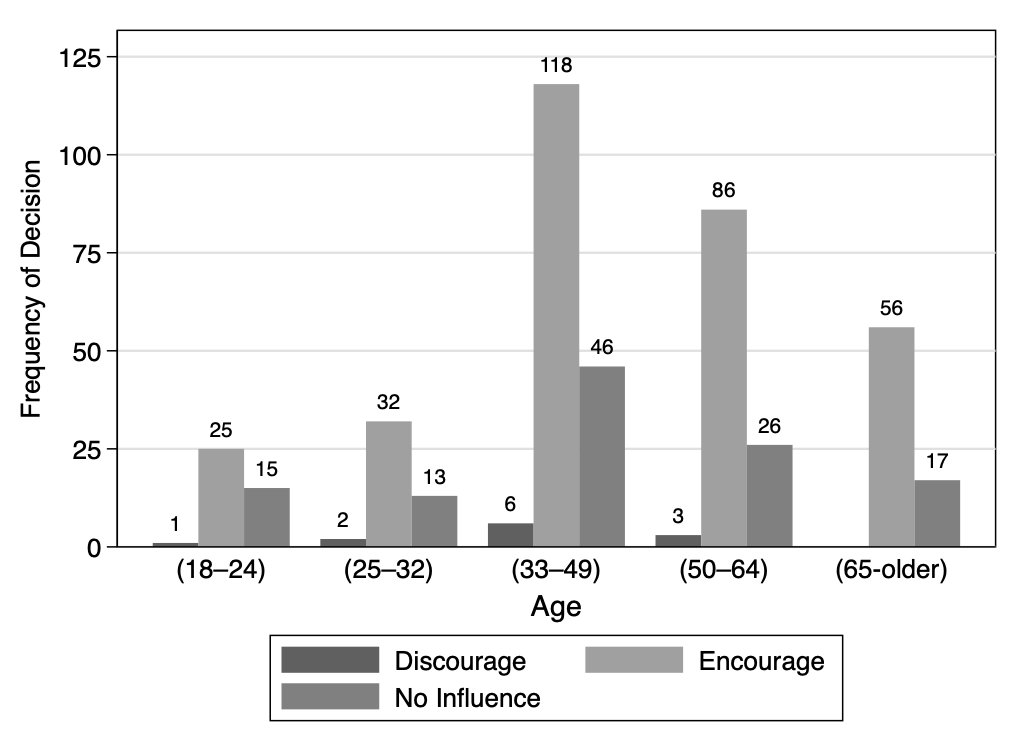
The 33-49-year-old age group had the highest percentage of individuals selecting that they were encouraged to vote by the Democratic VP selection at 37.2 percent, and they also had the highest percentage of individuals selecting not influenced to vote by the Democratic VP selection at 39.3 percent (see Figure 2). The group with the lowest percentage of individuals selecting that they were encouraged to vote by the Democratic VP selection was 18-24-year-old (7.9%), while the lowest percentage group of individuals selecting not influenced to vote by the Democratic VP selection was 25-32-year-old (11.1%) with the 18-24-year-old group coming in a close second (12.8%). The Pearson chi-square was 6.7 with a p-value of 0.57, so the variables are not independent.

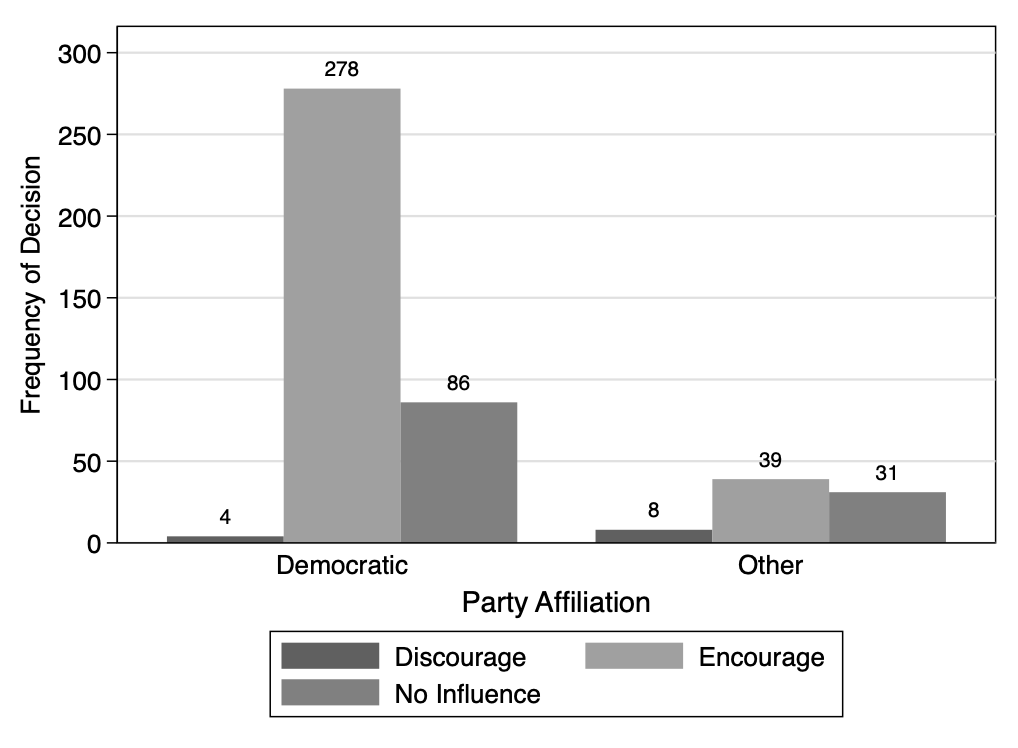
There were 75.5 percent of Democratic party members that selected they were encouraged to vote by the Democratic VP selection, while 23.4 percent of Democratic party members chose that they were not influenced to vote by the Democratic VP selection (see Figure 3). On the other hand, other party members were 50 percent encouraged to vote based on the Democratic VP selection, while 39.7 percent of other party members were not influenced by the Democratic VP selection. There was a higher percentage of Democratic party members saying that they were encouraged to vote (87.7%) or not influenced to vote (73.5%) by the Democratic VP selection in comparison to other party members (12.3%, 26.5%). However, although there were low frequencies for both groups in the option of being discouraged to vote by the Democratic VP selection, relative to the other options, other party members had a higher percentage (66.7%) than Democratic party members (33.3%). The Pearson chi-square was 32.6 with a p-value of 0.00, so the variables are independent.

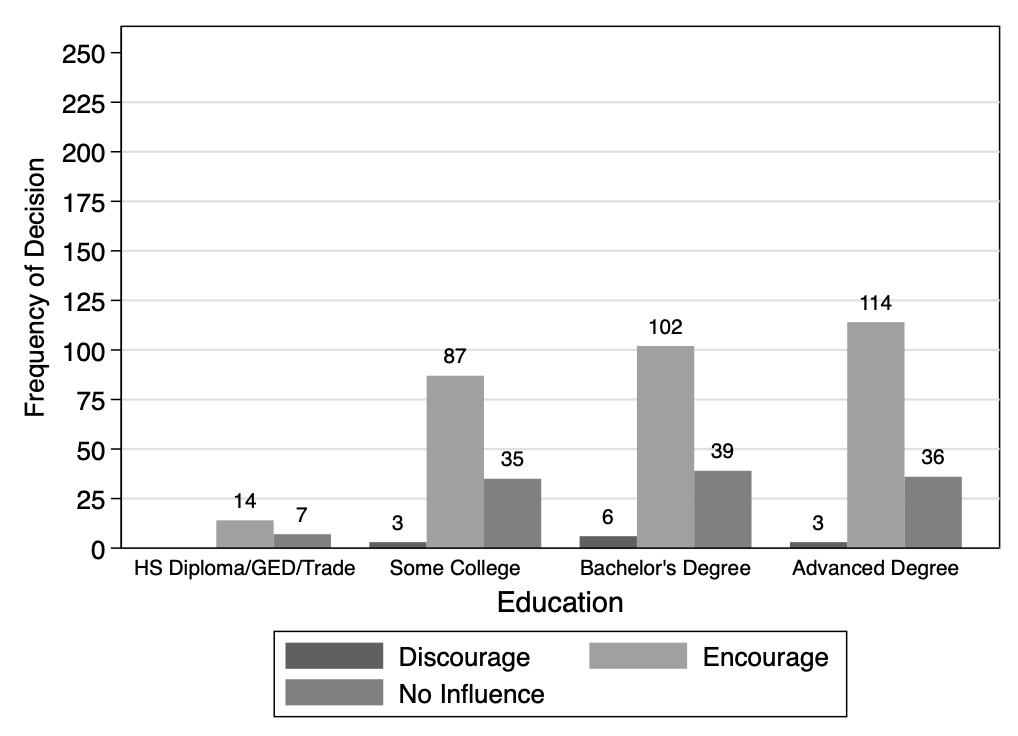
Regarding the Democratic VP selection affecting their decision to vote, 71 percent of registered black voters were encouraged, while 26.23 percent selected that the decision had no influence on their vote. Across all levels of education in the survey, the trend remained the same. For example, all education levels for the Democratic VP selection encouraging them to vote were the highest with high school/GED/trade at 66.7 percent, some college at 69.6 percent, bachelor’s degree at 69.4 percent, and advanced degrees with 74.5 percent (see Figure 4). Moreover, the trend was the same for individuals who were not influenced by the Democratic VP selection with high school/GED/trade at 33.3 percent, some college at 28 percent, bachelor’s degree at 26.5 percent, and advanced degrees with 23.5 percent. However, some individuals from three of the four education levels selected they were discouraged to vote by the Democratic VP selection with some college at 2.4 percent, bachelor’s degree at 4.1 percent, and advanced degrees with 2 percent. The Pearson chi-square was 3.36 with a p-value of .76, so the variables are not independent.

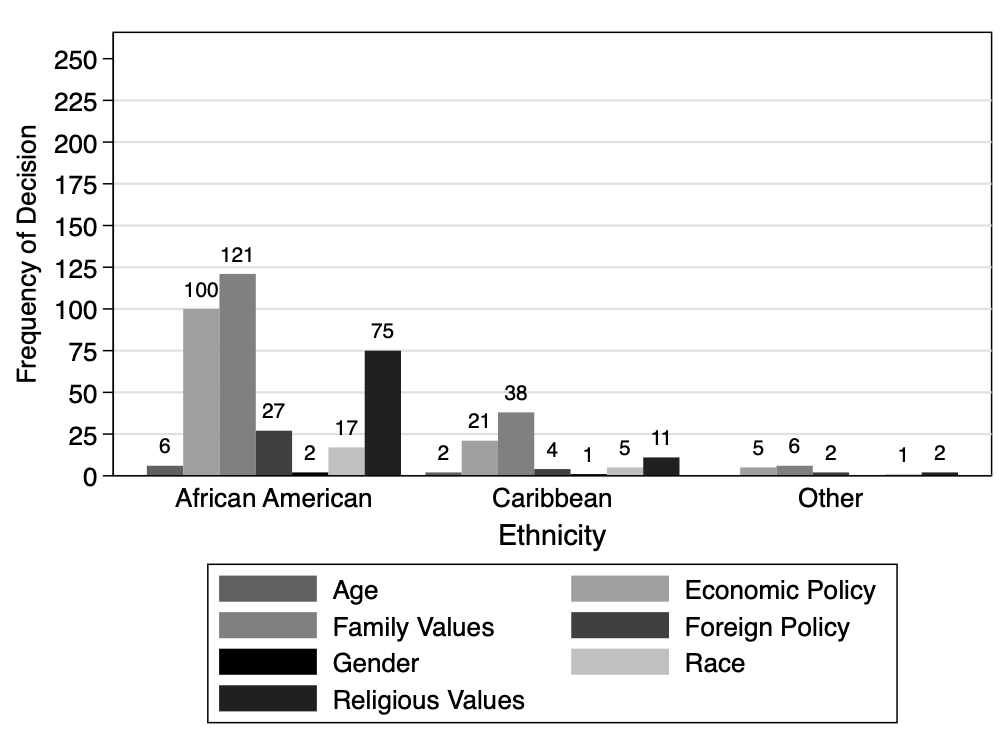
The three leading selections for what African Americans prefer in a candidate who is running for office are the following: family values (34.8%), economic policy (28.7%), and religious values (21.6%) (See Figure 5). Similarly, the three leading selections for what Black Caribbean Americans prefer in a candidate who is running for office are the following: family values (46.3%), economic policy (25.6%), and religious values (13.4%). Other Black voters also had family values (37.5) and economic policy (31.3) as their leading selections.

Model 1 from Table 1 shows the multinomial logit estimate comparing females to males for the Democratic VP selection encouraging their decision to vote relative to the Democratic VP selection discouraging their decision to vote. The multinomial logit for females relative to males is 1.068 unit higher for encouraging their vote to discouraging their vote. In other words, females are more likely than males to be encouraged than discouraged to vote by the Democratic VP selection. For Model 2, the multinomial logit for females relative to males is 1.2 unit higher for encouraging their vote to discouraging their vote, given all other predictor variables in the model are held constant. In other words, once again, females are more likely than males to be encouraged than discouraged to vote by the Democratic VP selection, given all other predictor variables in the model are held constant.
Model 3, Model 4, and Model 5 from Table 1 shows the multinomial logit estimate comparing other political parties to the Democratic Party for the Democratic VP selection encouraging party members’ decision to vote relative to the Democratic VP selection discouraging their decision to vote. The multinomial logit for other political party members relative to Democratic party members were about -2.4 units lower for encouraging their decision to vote than discouraging their decision to vote for Models 3-5, given all other predictor variables in the model are held constant. In other words, other political party members are less likely than Democratic party members to be encouraged than discouraged to vote by the Democratic VP selection, given all other predictor variables in the model are held constant.
Model 2 from Table 1 shows the multinomial logit estimate comparing females to males for the Democratic VP selection not influencing their decision to vote relative to the Democratic VP selection discouraging their decision to vote. The multinomial logit for females relative to males is 1.037 units higher for not influencing their vote to discouraging their vote. In other words, females are more likely than males to be not influenced than discouraged to vote by the Democratic VP selection.
Model 3-5 from Table 1 shows the multinomial logit estimate comparing other political parties to the Democratic Party for the Democratic VP selection not influencing party members’ decision to vote relative to the Democratic VP selection discouraging their decision to vote. The multinomial logit for other political party members relative to Democratic party members were about -1.5 units lower for not influencing their decision to vote than discouraging their decision to vote for Models 3-5, given all other predictor variables in the model are held constant. In other words, other political party members are less likely than Democratic party members to be not influenced than discouraged to vote by the Democratic VP selection, given all other predictor variables in the model are held constant.
Model 6 from Table 2 shows the relative risk ratio estimate comparing females to males for the Democratic VP selection encouraging their decision to vote relative to the Democratic VP selection discouraging their decision to vote. The relative risk for females relative to males increases by a factor of 2.909 for encouraging their vote to discouraging their vote. In other words, females are more likely than males to be encouraged than discouraged to vote by the Democratic VP selection. For Model 7 from Table 2, the relative risk for females relative to males increases by a factor of 3.319 for encouraging their vote to discouraging their vote, given all other predictor variables in the model are held constant. In other words, once again, females are more likely than males to be encouraged than discouraged to vote by the Democratic VP selection, given all other predictor variables in the model are held constant.
Model 8-10 from Table 2 shows the relative risk ratio estimate comparing other political parties to the Democratic Party for the Democratic VP selection encouraging party members’ decision to vote relative to the Democratic VP selection discouraging their decision to vote. The relative risk for other political party members relative to Democratic party members all decreased by a factor (0.0887, 0.0887, and 0.0897) for encouraging their decision to vote than discouraging their decision to vote for Models 8-10, given all other predictor variables in the model are held constant (see Table 2). In other words, other political party members are less likely than Democratic party members to be encouraged than discouraged to vote by the Democratic VP selection, given all other predictor variables in the model are held constant.
Model 7 from Table 2 shows the relative risk ratio estimate comparing females to males for the Democratic VP selection not influencing their decision to vote relative to the Democratic VP selection discouraging their decision to vote. The relative risk for females relative to males increased by a factor of 2.819 for not influencing their vote to discouraging their vote. In other words, females are more likely than males to be not influenced than discouraged to vote by the Democratic VP selection.
Model 8-10 from Table 2 shows the relative risk ratio estimate comparing other political parties to the Democratic Party for the Democratic VP selection not influencing party members’ decision to vote relative to the Democratic VP selection discouraging their decision to vote. The relative risk for other political party members relative to Democratic party members all decreased by a factor (0.217, 0.216, and 0.221) for not influencing their decision to vote than discouraging their decision to vote for Models 8-10, given all other predictor variables in the model are held constant (see Table 2). In other words, other political party members are less likely than Democratic party members to be not influenced than discouraged to vote by the Democratic VP selection, given all other predictor variables in the model are held constant.
Discussion
The findings from our study revealed that race and gender were perceived to be not seen as an important preference in a candidate running for office to Black voters in the state of Florida. However, it was interesting that the results also showed that the selection of Kamala Harris as the vice presidential nominee for the Democratic Party encouraged them to vote by a large margin. The question we are left to puzzle over is if the selection was a “woman of color”, which hints at the importance of race and gender, or whether it was an attempt to appear that race and gender were not important. If race and gender was not a consideration, one would assume that her selection would have more “no influence” survey responses across gender and party affiliation.
Our models provided significant evidence that females are more likely than males to be encouraged than discouraged to vote by Harris as the Democratic VP selection, given all other predictor variables in the model are held constant. In addition, females are more likely than males to be not influenced than discouraged to vote by Harris as the Democratic VP selection. This introduces inconsistencies between the attitudes and behavior of Florida Black voters. On one hand, in the initial portion of the survey, Florida Black voters did not have gender as a top consideration for candidates, but when the latter question regarding decisions to vote based on Harris as the Democratic VP selection, both females and males shared that they were encouraged by the selection of a Black female candidate by a large margin. Furthermore, females were the group that was more susceptible to being more inclined to vote for a Black female candidate based on our predictive models.
Therefore, what do these findings suggest as it pertains to the larger research picture? The most striking finding from this study was that race was not a highly considered factor when deciding on a candidate. Recall that political empowerment theory suggests the idea that when minority individuals share the same descriptive characteristics (i.e., race or ethnicity) as a potential candidate, their participation in politics would be increased in a positive manner (Banducci et al., 2004; Bobo & Gilliam, 1990; Washington, 2006). This leads us to conclude that this is an important finding because it contradicts the literature on descriptive representation and the assumption that it is very important for voters to be represented by someone who shares their race or ethnicity. Furthermore, race was not the only descriptive characteristic not considered. For example, the least important considerations in a candidate for Florida Black voters were also gender and age.
The literature also stated that racial solidarity among Blacks, which highlights racial group consciousness, allows individuals of the same race/ethnicity to engage in behavior that benefits the group (Dawson, 1995). Racial solidarity addresses the contradiction our results found. For instance, although race and gender were perceived to be not seen as important preferences in a candidate running for office, the results showed that the selection of Vice President Harris as the nominee for the Democratic Party encouraged them to vote by a large margin.
This might not imply that race does not matter, instead that race as a consideration alone to Black voters is not enough. Perhaps when race and their issues align (such as during Jessie Jackson’s and Barack Obama’s campaigns), race will then be an important consideration. Future research can help explain if this is a reason why some Black candidates fail in capturing a significant margin of the Black vote, while other Black candidates succeed. Here we examine Kamala Harris who had previous professional and political experience at the state and national level of government. Harris was considered a strong candidate for the Democratic presidential candidate Joe Biden and the party as a whole because of her ability to connect to two demographic groups: racial minorities and females.
However, recall that Shirley Chisholm was also a “woman of color,” yet she was not successful in capturing the Black vote. If we revisit political mobilization, it stresses the emphasis on how mobilization efforts affect voter turnout and which efforts are most effective (Rosenstone & Hansen, 1993). As it pertains to party politics’ mobilization efforts, Chisholm was seen as too radical among some Black voters and other members who belonged to the Democratic Party. Jesse Jackson was also not a favorite because he was seen as untimely by some Black voters and other members who belonged to the Democratic Party. However, mobilization efforts among the Democratic Party shifted after the election of Barack Obama (i.e., the first president of “color”). The mobilization efforts we explored for this study were surrounding voting cues on candidate personal traits and to see whether it influenced voter turnout among Black voters in Florida.
For instance, while factoring in party affiliation, we found that a large margin of all respondents claimed that they were encouraged to vote when a “woman of color” was selected as the Democratic Vice Presidential candidate, which was led by respondents who identified as Democrats. However, about 26.2 percent of the respondents mentioned that the decision had no influence on their voting decision. It is important to note that our statistical test showed that there was a significant difference across party affiliation groups. This is also shared across our predictive models, which showed that other political party members are less likely than Democratic party members to be encouraged than discouraged to vote by Harris as the Democratic VP selection, given all other predictor variables in the model are held constant. Moreover, other political party members are also less likely than Democratic party members to be not influenced than discouraged to vote by Harris as the Democratic VP selection, given all other predictor variables in the model are held constant.
One of the limitations of this study is that we used one exemplar (i.e., Kamala Harris) and one election (i.e., 2020 Presidential Election) to access what Black voters in Florida preferred in a candidate running for office. Future studies could provide a comparative perspective if it was to either access two or more candidates with similar backgrounds. Another limitation of this study is that although it may contradict the individuals who were influenced to vote based on Harris’ selection as the Democratic Party vice presidential nominee because she is a “woman of color,” it may have been response bias. However, although complexities and nuances of the Black vote need to be accounted for when making conclusions about Blacks and speculating about how they vote, the findings here suggest that at different levels Black voters have similar opinions about what they consider in candidates.
For example, Jesse Jackson ran for president in 1984 and 1988. Jackson received twice as many votes (Black and Hispanic turnout was much higher than in 1984) with his rainbow coalition and also won several state primaries and often made candidates address nontraditional issues.
Based on the 2020 data from the Division of Elections of Florida’s Department of State, the sample used in this study closely reflects the makeup of Black registered voters in the state. For example, there are 1,526,297 Black registered Democrats, 326,196 Black non-party affiliates, 68,383 Black registered Republicans, 15,124 Black registered Independents, and about 2,188 Blacks who are registered as others.
The non-binary group was not large enough (one respondent) to draw any reliable conclusions from this group, so we removed this group from the data.